Getting Started with the Performance Data Investigator
Dawn May reviews how to get started with the Performance Data Investigator in Navigator for i

The Performance Data Investigator (PDI) is a valuable feature found in Navigator for i. With new Navigator, there are some changes to PDI. This post reintroduces Navigator for i as it exists today.
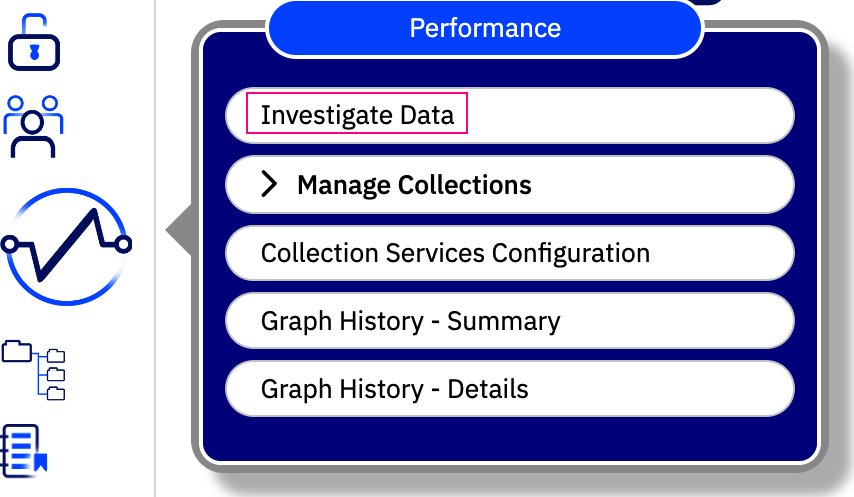
In Navigator, you will find the Performance tasks in the left-hand navigation pane. Select the Investigate Data task within the performance tasks to start the PDI. When you select the Performance tasks, you will see the following options:


In the Context area, you select the performance collection you want to work with. By default, you will see the library specified in the Collection Services configuration, which is typically QPFRDATA, and the last viewed collection, which will be the current collection the first time you use PDI. You can also select the charting interval, which defaults to View all points, which will display the data with intervals at which it was collected, but you can override this to larger intervals.
When you change the collection library, graph interval or collection name, PDI remembers the selections and they will be shown the next time you return to investigate performance data.
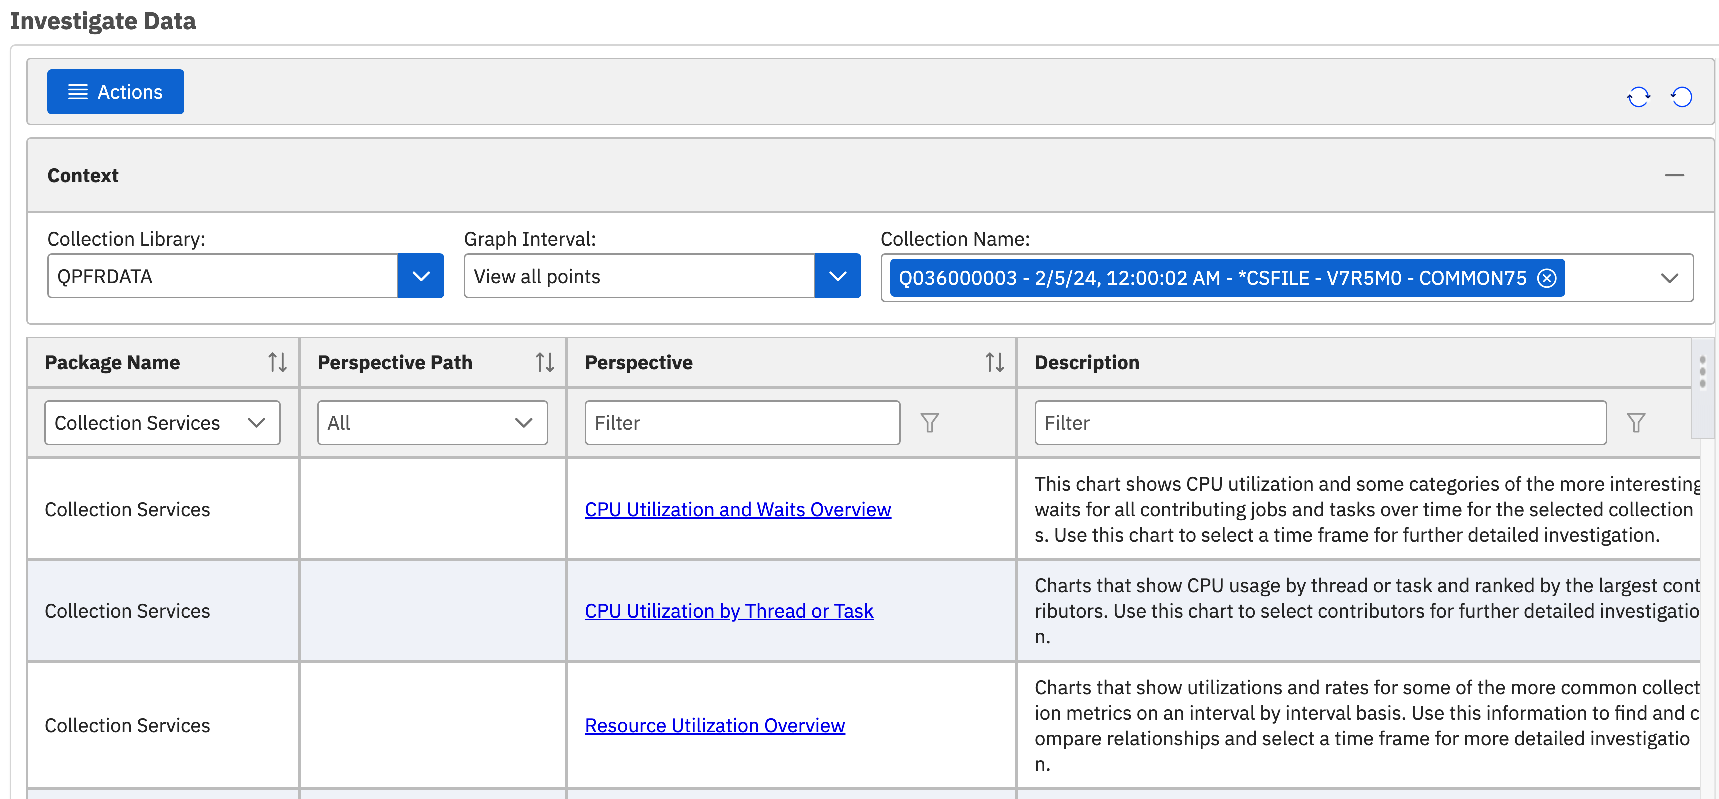
Below Context is a table that has, by default, four columns:
- Package Name: A package is how different types of performance data area organized; a package has a set of charts based upon the same type of performance data. The default selection of Collection Services contains graphs and tables based upon Collection Services data. If you want to visualize other types of performance data, you select the appropriate package.
With the software simplification changes IBM made in May of 2022, you no longer need the Performance Tools product installed; all types of performance data can be viewed with PDI for no additional charge.
- Perspective Path: The perspective path column organizes the available perspectives (which is simply a fancy name for a graph or table) into categories to assist in finding the desired charts. The perspective path column is similar to the navigation tree PDI had in Heritage Navigator.
- Perspective: The perspective column is where you select the actual chart or table you wish to display. When you click on the blue perspective link, it will launch the chart, so be sure you have selected the desired collection before clicking on the perspective name itself.
- Description: The description column gives a brief explanation of the chart, which may or may not be useful.
There are additional columns that can optionally be added to the table, two of which are SQL and Metrics. These columns are useful for advanced users looking for very specific information.
At the top left of the interface, you will find the Actions drop-down. The actions are only available when you have selected a row with the perspective of interest. The actions are the same as if you were to right-click on a row in the table.
Once you have selected the performance collection and identified the graph or table you want to display, you can simply click on the link to open the chart, or you can right-click and take Investigate Data (new tab) to open the chart in a new tab. Opening the chart in a new tab is helpful if you want to have a few charts open to compare.
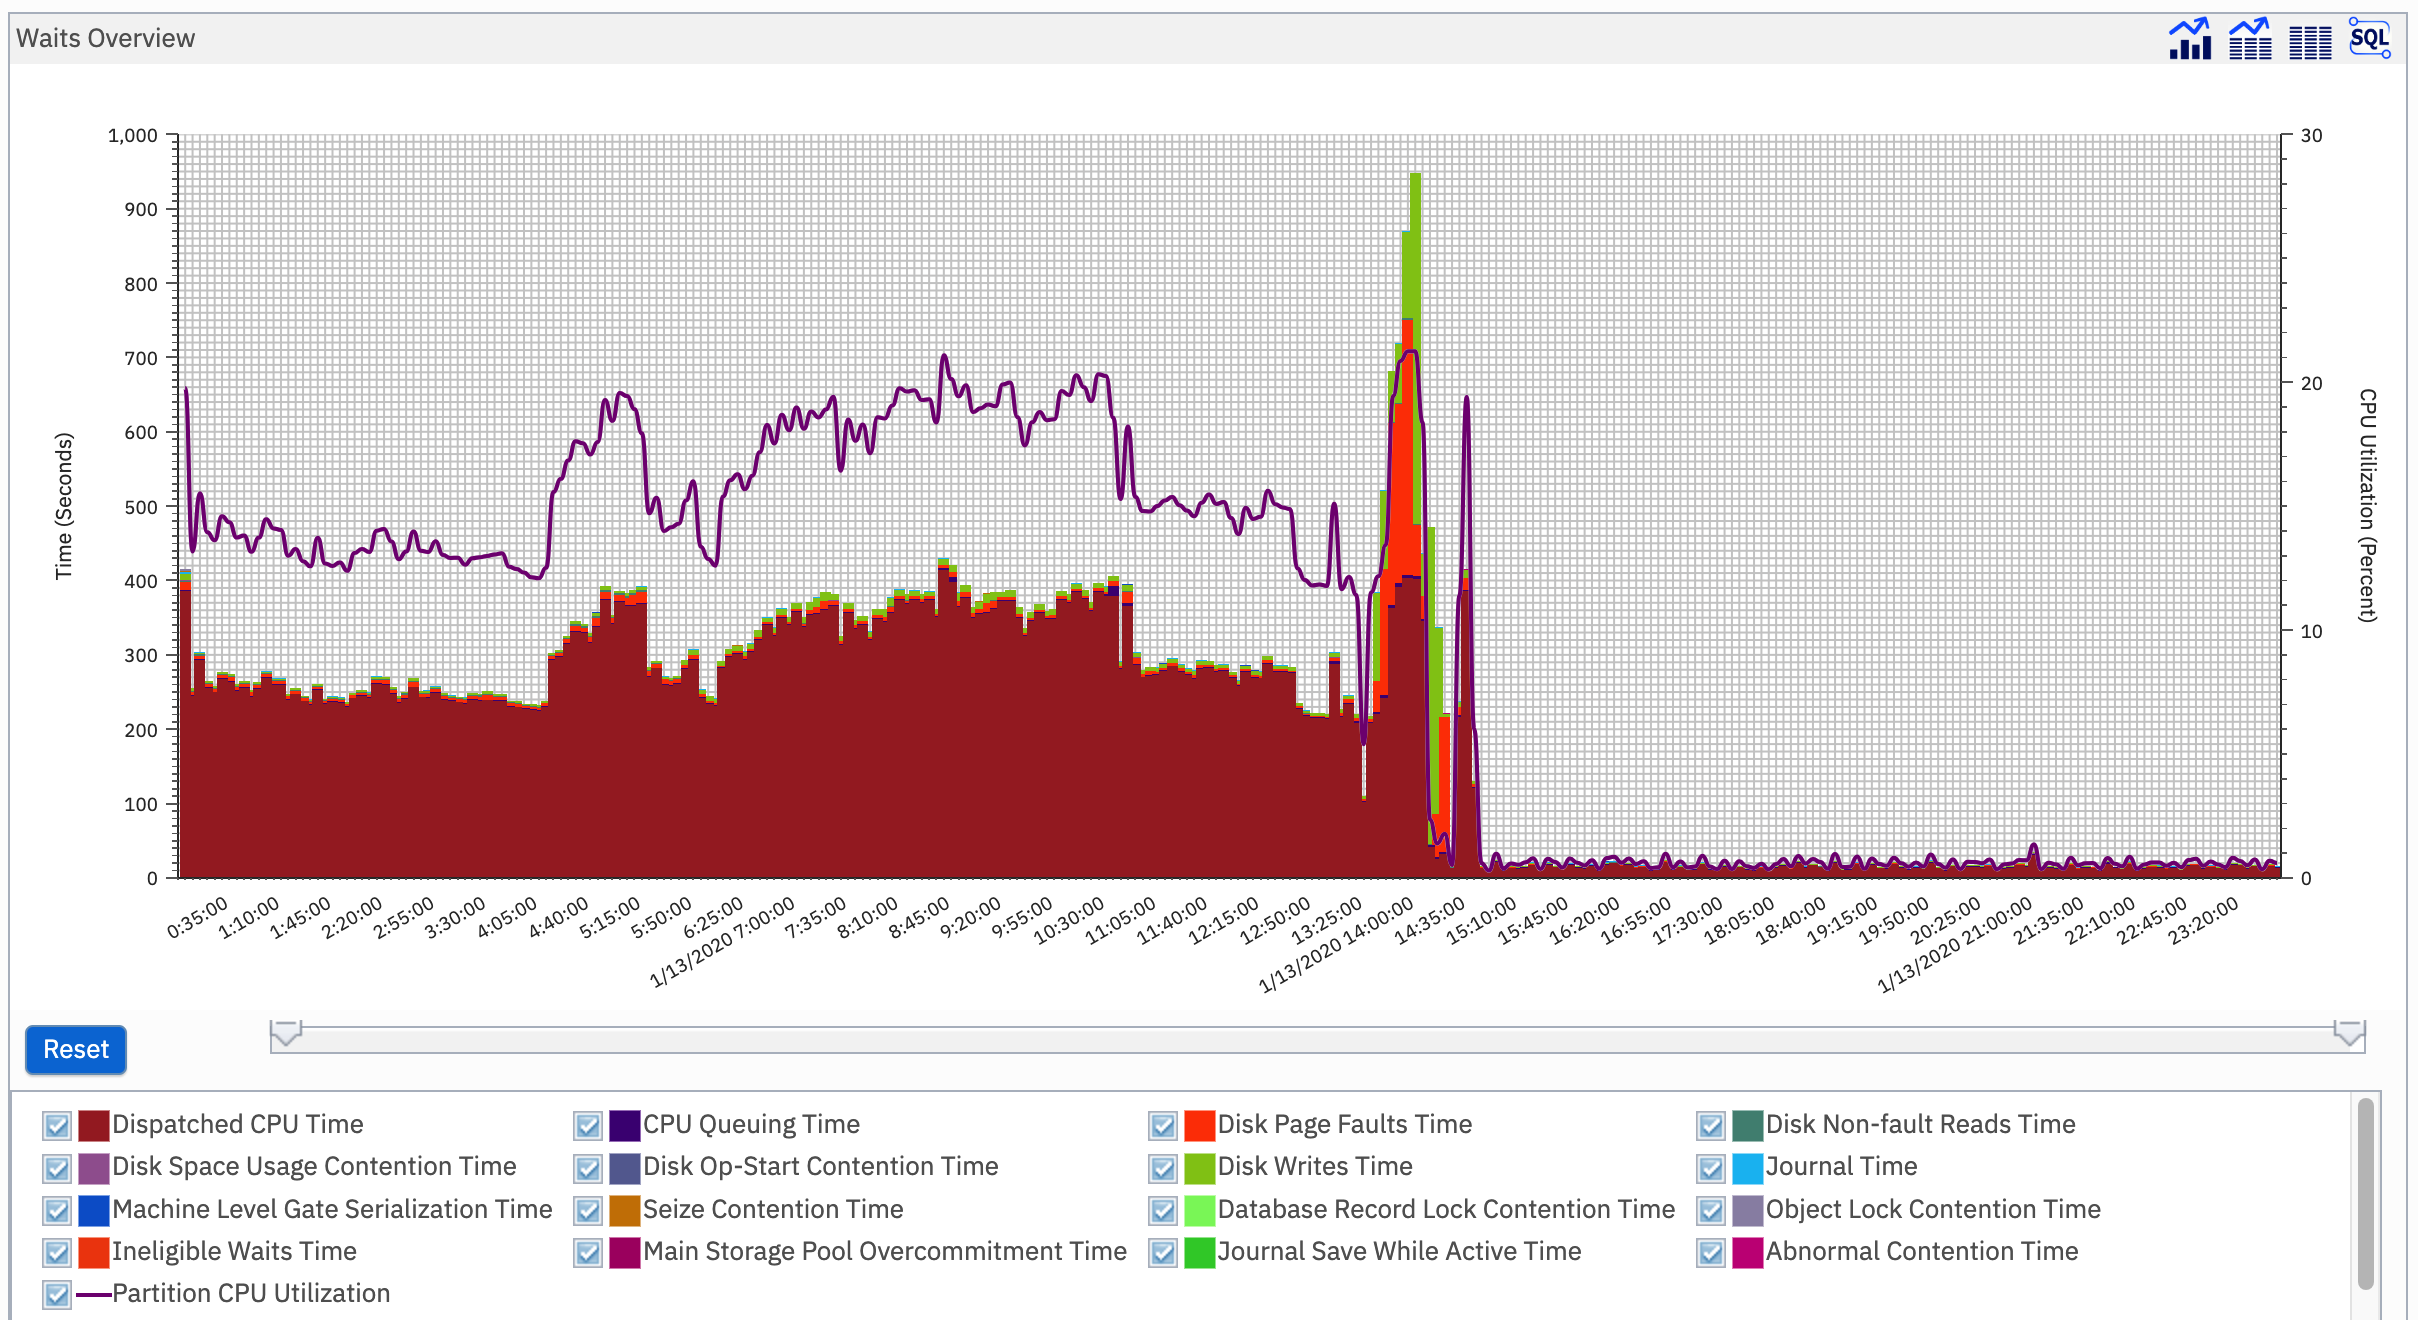
The figure below shows an example of what a Waits Overview chart looks like. This is a great starting point as it shows the performance signature of the partition as a whole and can be very useful in determining where additional investigation should be done.
The Performance Data Investigator is feature-rich and can give amazing insights into what is happening on your IBM i partition. There are many older i Can blogs that have been written about using PDI, but with the enhancements over the years, I look forward to many new posts exploring the features of PDI.